
UV-Vis Analysis Solutions with SpectroWorks™
UV-Vis Analysis Solutions
Gain better insights to your data through application specific solutions provided by cphnano.
SpectroWorks™ supports the ability to share its data to any 3rd party tool via API keys. Access all projects or select the ones needed to perform further analysis depending on the application. We use Google Colab and provide custom and free report templates, quality control templates, standard curve report template etc.
We provide custom notebooks and consultancy for your specific needs. See our free templates in the knowledge base.
EXAMPLE
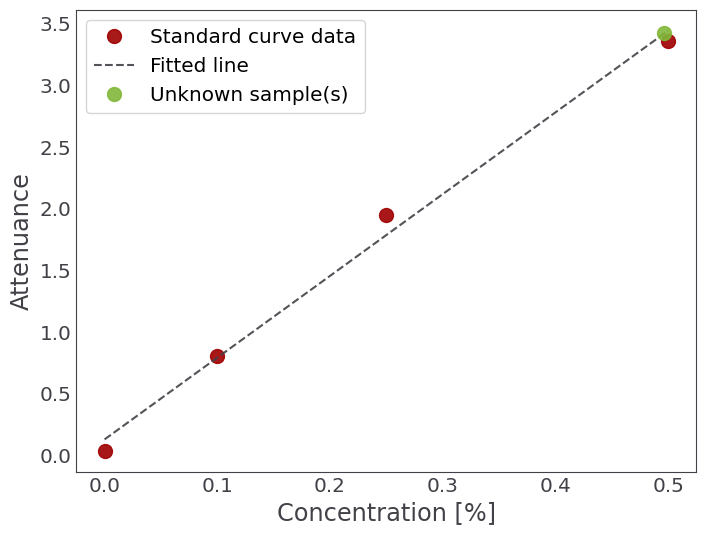
Standard curve report template for UV-Vis spectra
Challenge. Plot the standard curve spectra from SpectroWorks™, calculate a linear fit for the standard curve and use this to determine concentrations in an unknown sample.
Solution. By inserting the API key from SpectroWorks™ you can use the interactive Jupyter notebook to plot the standard curve, calculate a linear fit and then obtain concentrations in an unknown sample.
EXAMPLE
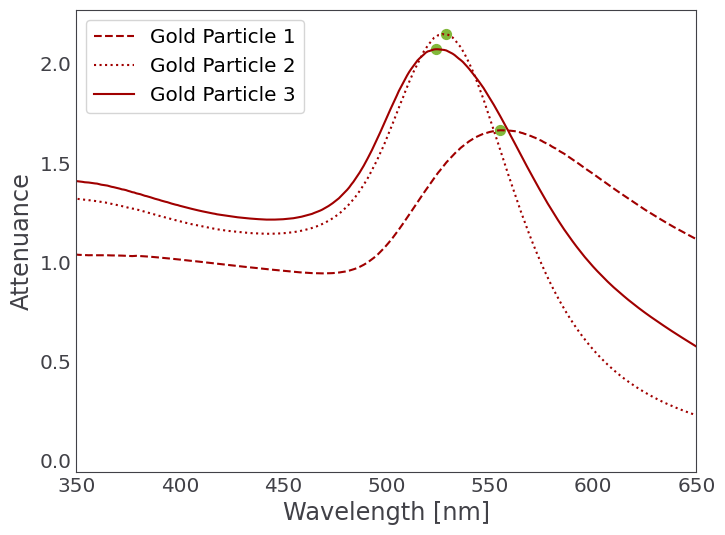
Calculation of properties of metal nanoparticles
Challenge. Analyse a spectrum containing metal nanoparticles and obtain information on their size and other useful properties.
Solution. Identifies the absorption values and calculates useful ratios and uses equations from literature to calculate an estimate for the diameter of the particles, with fully customisable parameters.
EXAMPLE
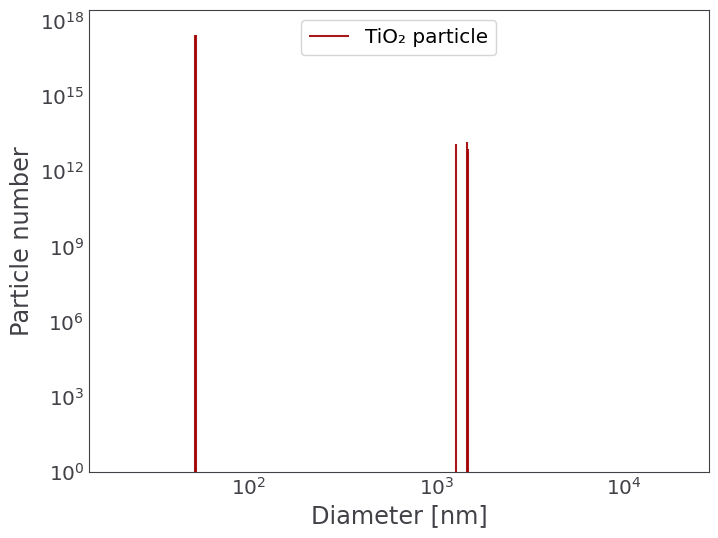
QC for absorbance, particle size and concentration of TiO₂
Challenge. Analyse large quantities of titanium dioxide to ensure the samples are within desired ranges of absorbance, particle size and concentration.
Solution. Process hundreds of samples of titanium dioxide in seconds and return pass/fail results for the desired values of absorbance, particle size and concentrations.